
Where the Beer Goes: Improving Yield from Tank to Package
A brewery can produce beer that meets every target and still lose margin before it reaches the customer.
The loss is rarely confined to one dramatic event. More often, it accumulates through the whole production process e.g. beer retained in yeast and trub, inefficient transfers, filtration losses, extended changeovers, over-processing and packaging inefficiencies. Individually, each loss may appear small. Across a full production schedule, however, they can represent a significant volume of saleable beer.
Improving yield more than simply a matter of reducing waste, requires an understanding of how technical decisions made throughout production affect both product quality and efficiency.
Start by making the loss visible
A good approach is to measure volume at several control points:
Wort transferred to the fermenter
Beer available after fermentation
Beer transferred from yeast and trub
Beer entering and leaving filtration
Beer transferred to the bright beer tank
Saleable volume packaged
This creates a volume balance for each batch. The difference between two measurement points indicates where further investigation is required. E.g. data or root cause analysis.
It is also useful to translate losses into financial terms:
Cost of loss = Volume lost × Contribution value per litre
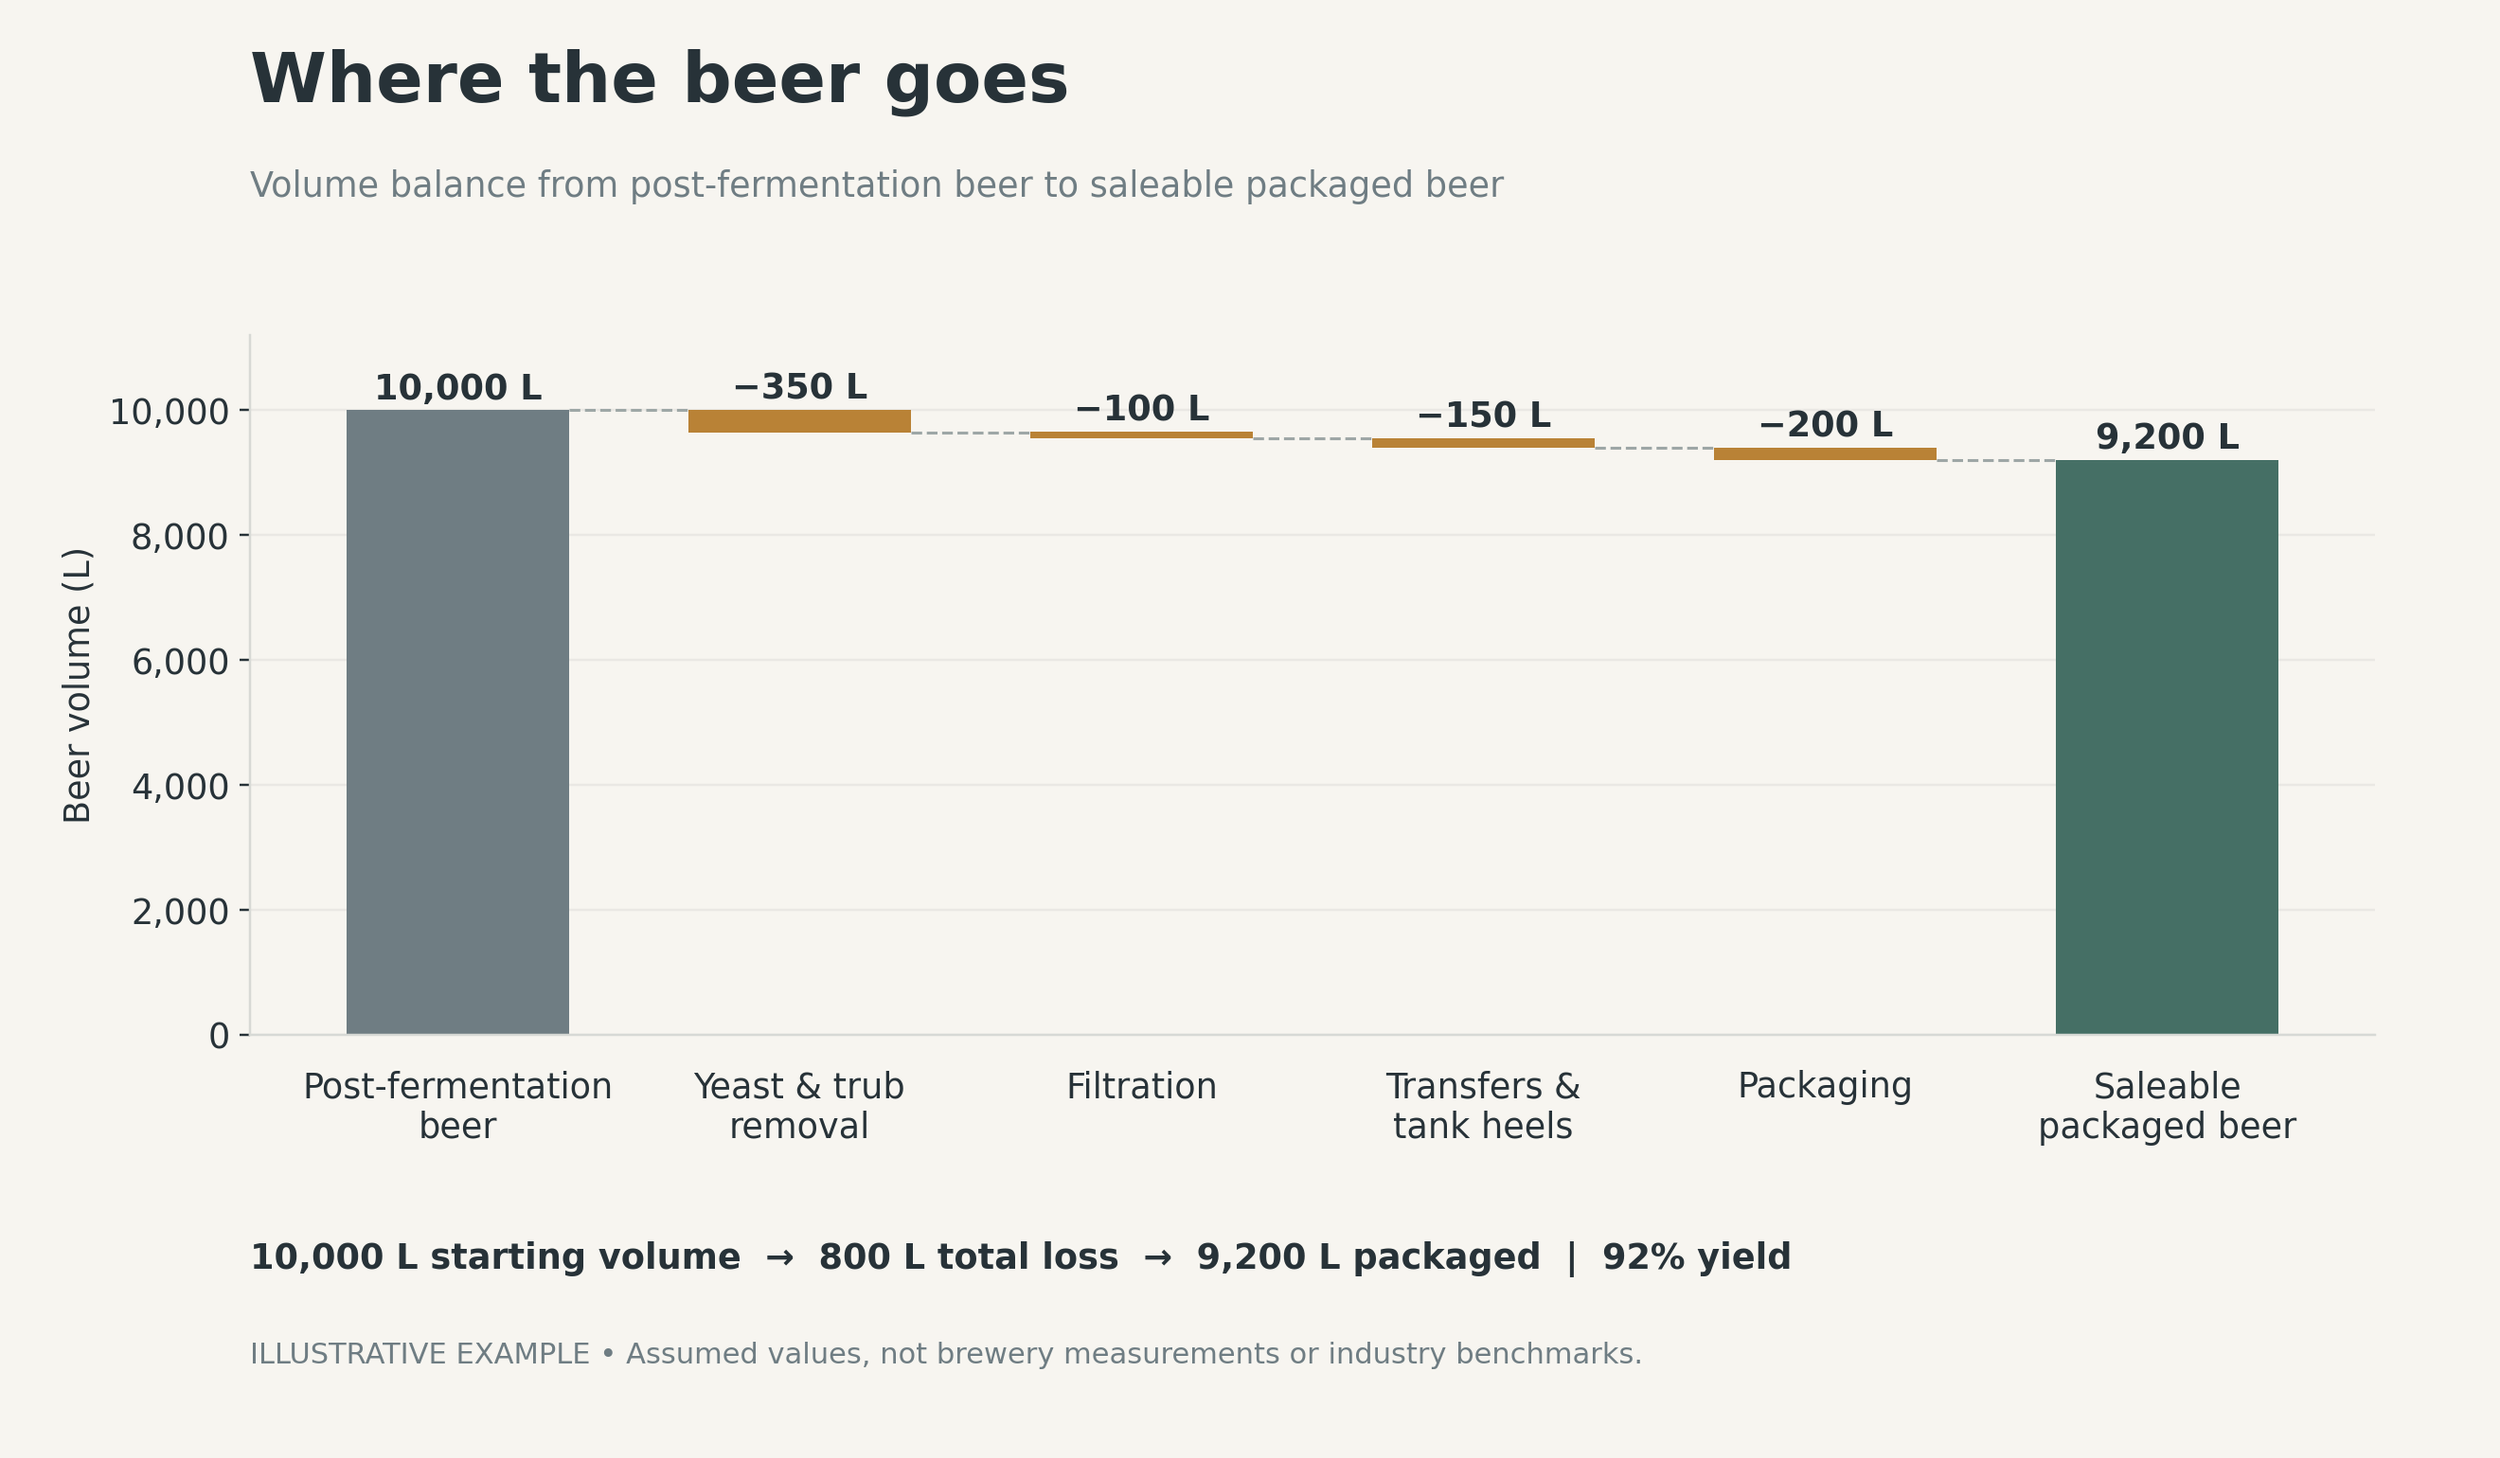
Beer retained in yeast and trub
Some beer will always remain within this sediment, but the quantity can be influenced by process decisions.
Potential contributors include:
Excessive trub carried into the fermenter
High dry-hop loading or poor hop separation
Yeast cropping practices that remove unnecessary beer
Drawing beer too quickly from above an unsettled sediment bed
Inconsistent settling or conditioning time
Conservative transfer endpoints that leave recoverable beer behind
The answer is not simply to transfer more aggressively. Disturbing the sediment can increase solids loading downstream, reduce filtration capacity and potentially affect flavour, stability or appearance.
The key enabler is to optimise the boundary between recovery and quality. This may include controlled yeast cropping, defined settling times, appropriate transfer rates and clear endpoint criteria based on turbidity, visual assessment or other process measurements.
Where beer recovery from yeast or trub is commercially justified, it must be managed as a controlled process. Microbiological risk, oxygen exposure and flavour consistency should be evaluated before recovered beer is returned to the main product stream.
Filtration should protect yield
A filter that blocks prematurely may retain beer, require additional changeovers and interrupt production. An oversized or unnecessarily complex process may add hold-up volume, water use, cleaning time and consumable cost without producing a meaningful improvement in the finished beer.
Filtration should therefore be selected around the actual product and process requirement rather than applying the same arrangement to every beer.
Selecting an appropriate filtration approach
Depending on solids loading, required clarity, batch size and the downstream process, breweries may consider:
Bag filtration for economical removal of larger suspended material
Polypropylene cartridge filtration for finer and more controlled clarification
Lenticular filtration where greater depth-filtration capacity or defined clarification performance is required
A staged combination of technologies when protecting the final filtration step improves overall capacity and consistency
A practical configuration may use a 1 or 5 μm bag filter followed by a 5 μm AEB Fluid Clean polypropylene cartridge. The bag filter provides an initial solids-removal stage, while the cartridge supports consistent downstream filtration.
Avoiding premature blockage and excessive losses
Where filters block earlier than expected, replacing the filter with a more open grade may treat the symptom without resolving the cause.
The brewery should first investigate whether upstream conditions have changed:
Was the beer given sufficient time to settle?
Was yeast or trub disturbed during transfer?
Has dry-hop loading increased?
Is the transfer rate higher than normal?
Is the filtration area appropriate for the batch?
Was the filter prepared and installed correctly?
Is differential pressure being monitored consistently?
Tank-to-package losses
Packaging performance is often reviewed through speed and efficiency, but yield should be monitored alongside these measures. A line can achieve its speed target while losing excessive product through out of specifications, foam or extended start-up.
Losses can occur through:
Beer remaining in transfer lines and hoses
Tank bottoms and unusable heel volume
Overfilling
Foaming
Unstable transfer from filling to seamer (spillages)
Unstable carbonation or temperature

The hidden cost of over-processing
More processing does not automatically produce better beer.
Extended conditioning, repeated transfers and filtration beyond the required specification can consume capacity and increase the opportunity for product loss. Additional handling can also introduce oxygen, disturb settled solids or create greater hold-up within the process.
Useful questions include:
Is the beer being filtered to a specification tighter than the product requires?
Is conditioning time based on measured readiness or historical habit?
Does another transfer meaningfully improve quality?
Is the same filtration train being used for every beer regardless of solids load?
Are repeat passes correcting an upstream problem?
Does the additional processing create a measurable customer or shelf-life benefit?
The correct endpoint should be defined by product requirements. Once those requirements have been achieved, further processing may add cost without adding value.
Technical decisions are commercial decisions
Yield improvement does not mean forcing every possible litre into the finished product. Quality, food safety, flavour stability and brand consistency must remain protected.
The objective is to distinguish unavoidable process loss from preventable loss. And remove non-value adding steps or activities from the process.
Below is a graph that shows the financial value of improved yield.
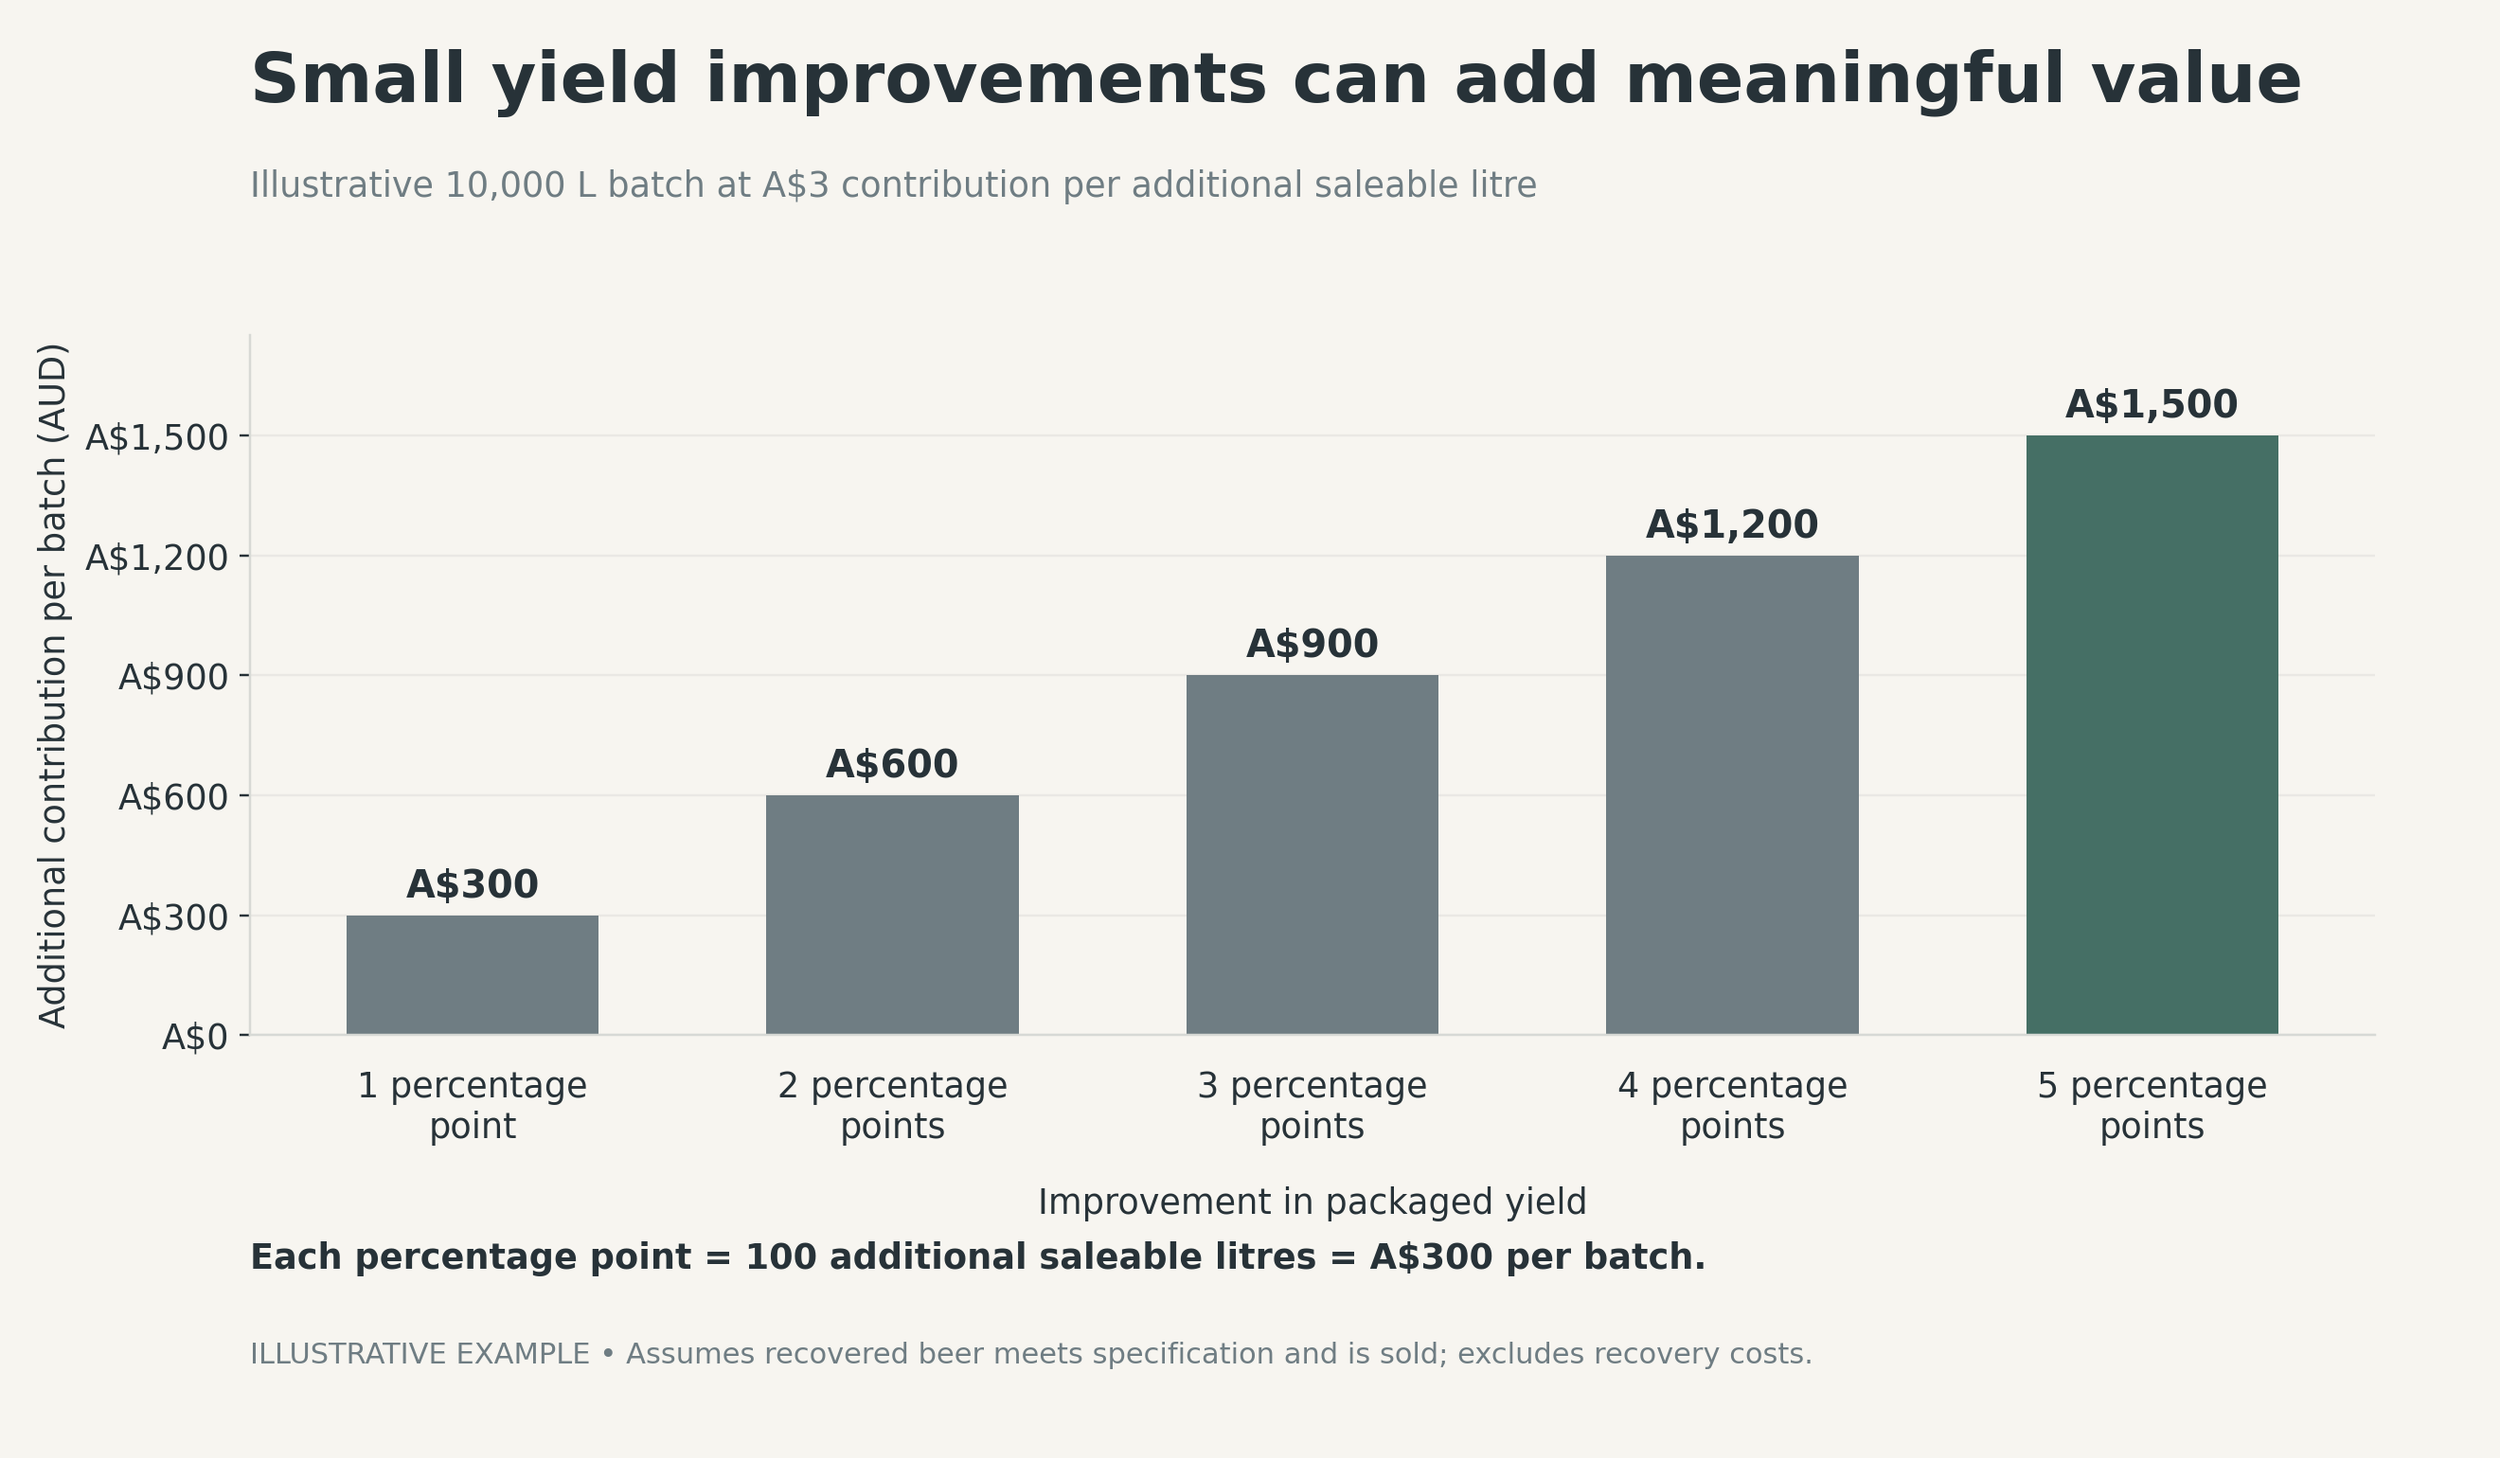
For a 10,000 L batch, each percentage-point improvement in packaged yield represents another 100 L of saleable beer. At an assumed contribution of A3/L,thatisA300 per batch before additional recovery costs

Ana Victoria Vasquez de la Peña
ana@neumaker.com.au

10th October 2025
© 2025 neumaker. All rights reserved. This article may be shared/forwarded for personal or educational purposes, provided it remains unaltered and includes proper attribution. Reproduction, distribution, or use in any other form—including but not limited to commercial purposes, republishing, or adaptation—without explicit written permission is strictly prohibited.